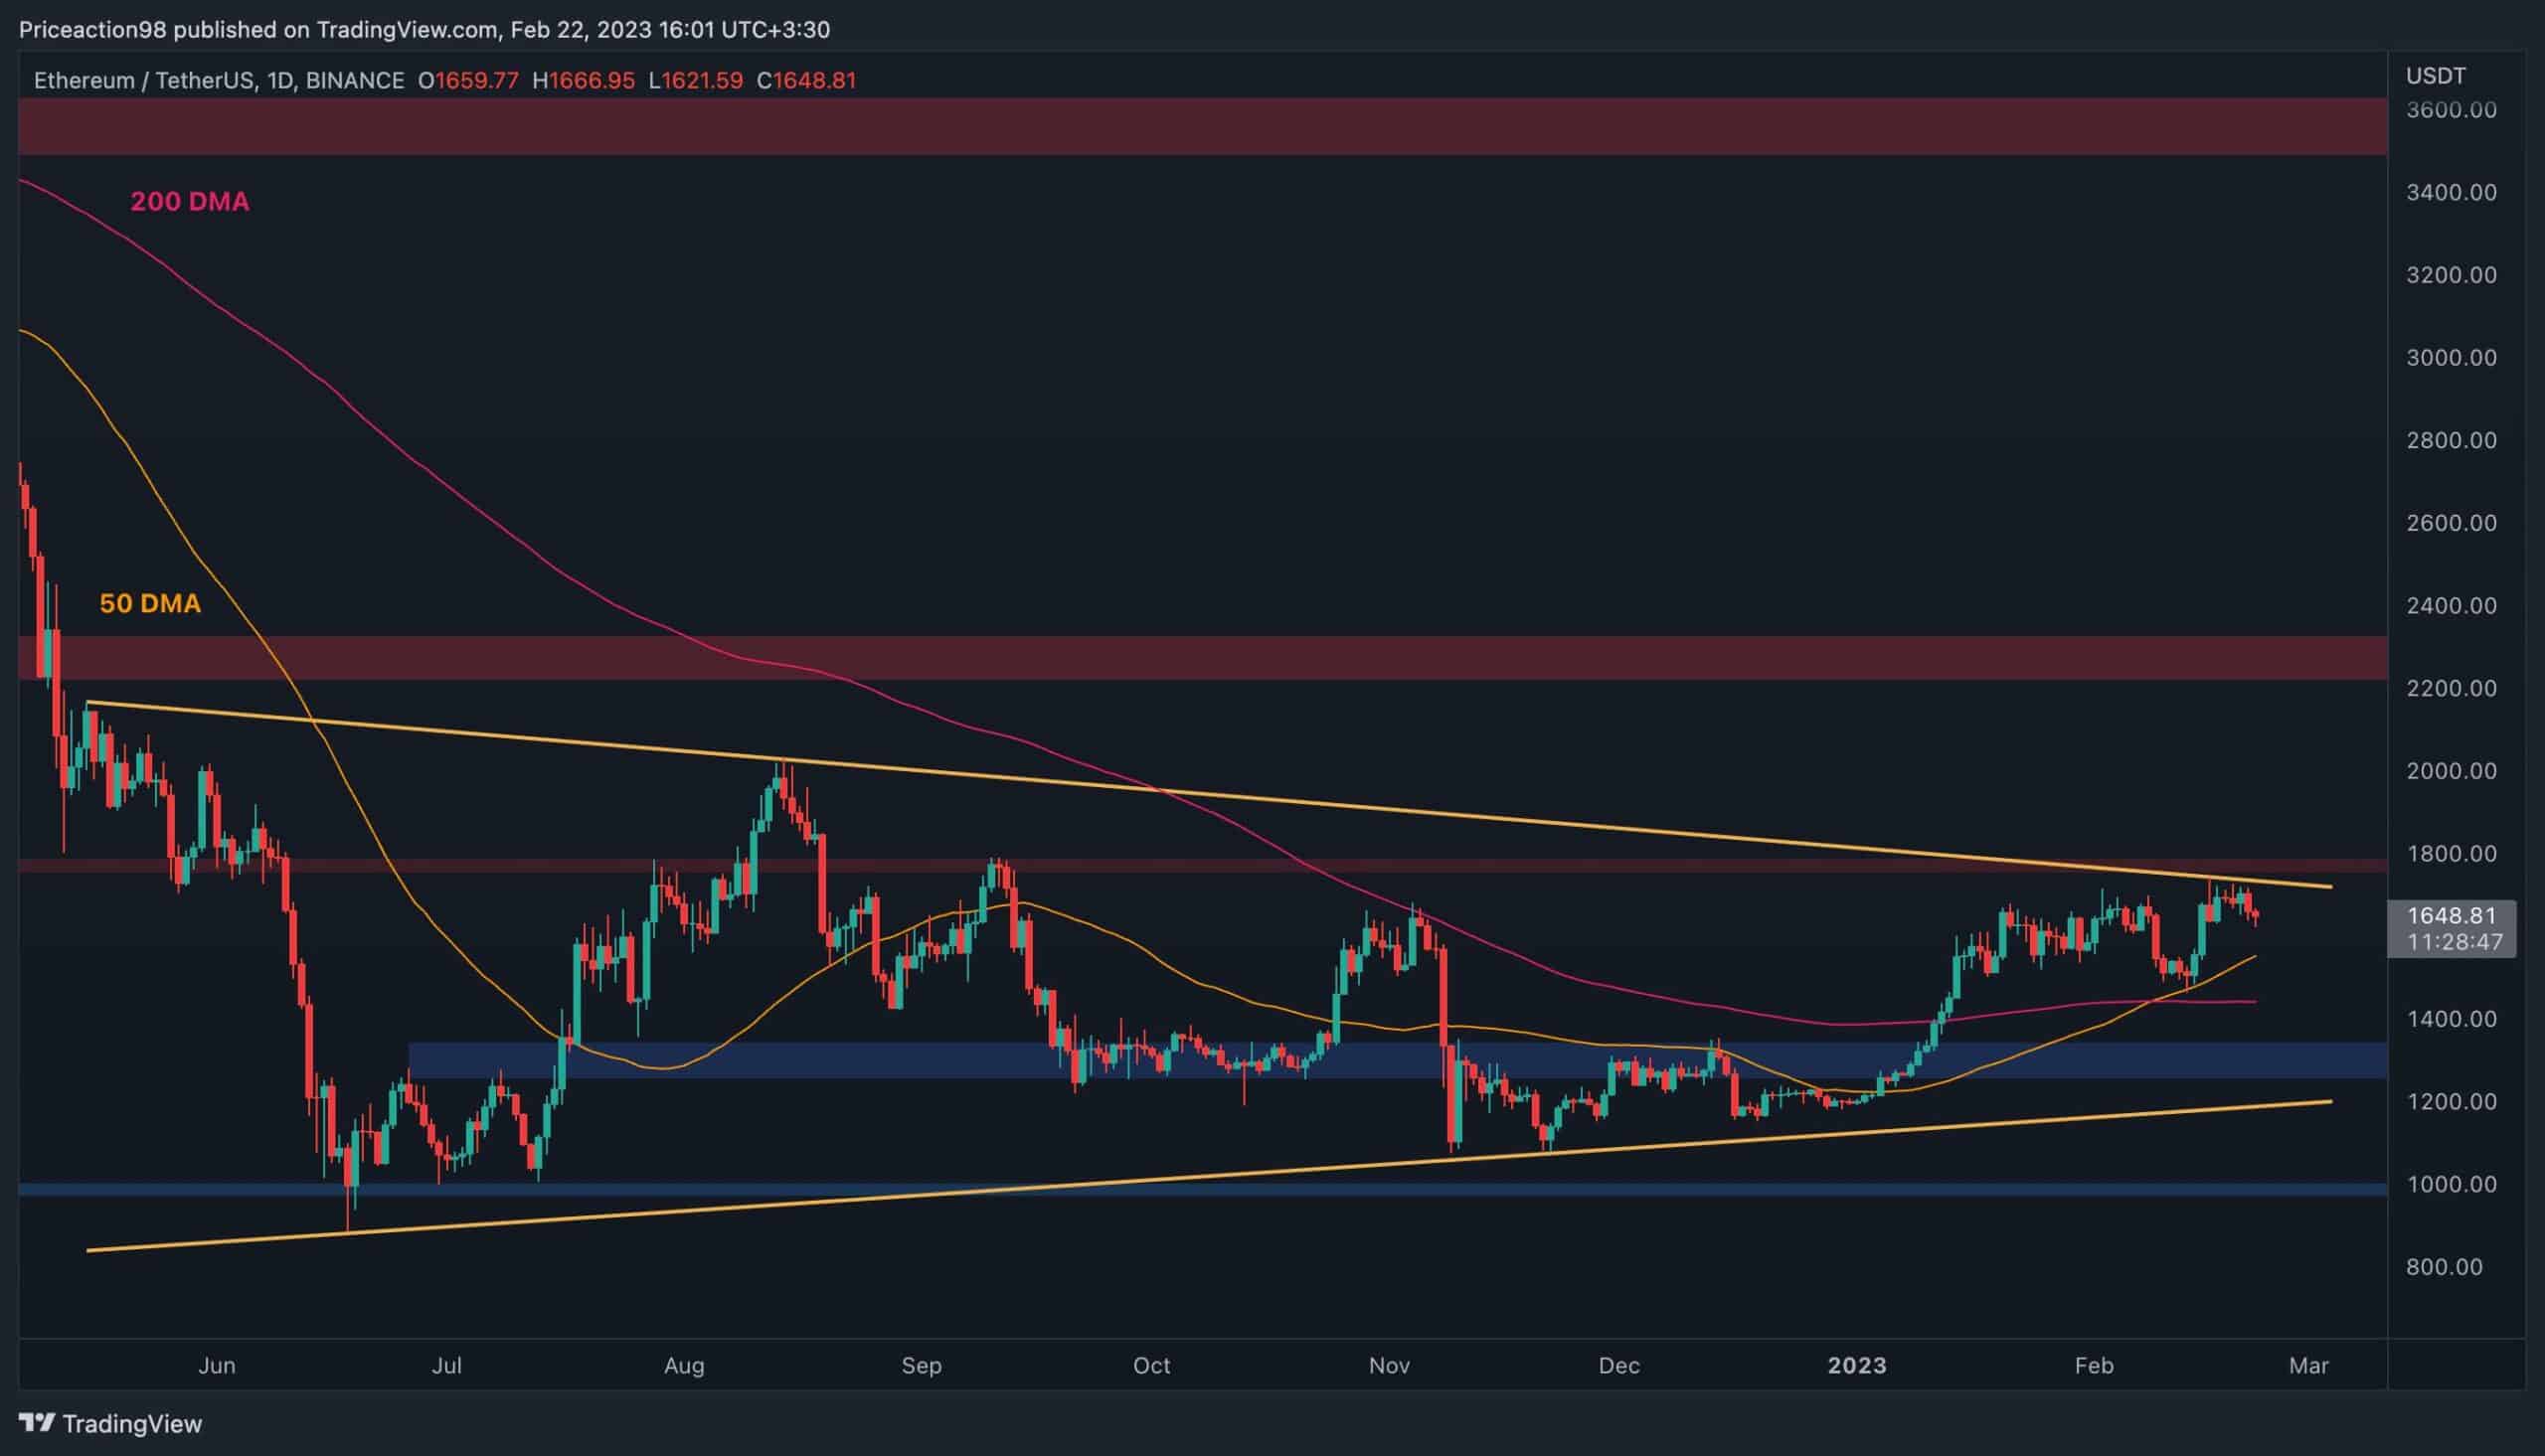
Ethereum’s price is struggling to break above a key resistance level following a substantial rally over the last couple of months. However, there are multiple support levels that could hold the price in case of a reversal.
Iloiloga Technical
ala i le: Edris
Le Siata Aso Taitasi
On the daily timeframe, the price has failed to break above the $1800 level and the higher boundary of the large symmetrical triangle pattern.
The cryptocurrency appears to be facing rejection to the downside at the moment, with the 50-day and 200-day moving average lines available as potential support levels around $1550 and $1400. Furthermore, in case the market pulls back even deeper, the $1300 support zone would be a key area to watch.

O le Siata e 4 Itula
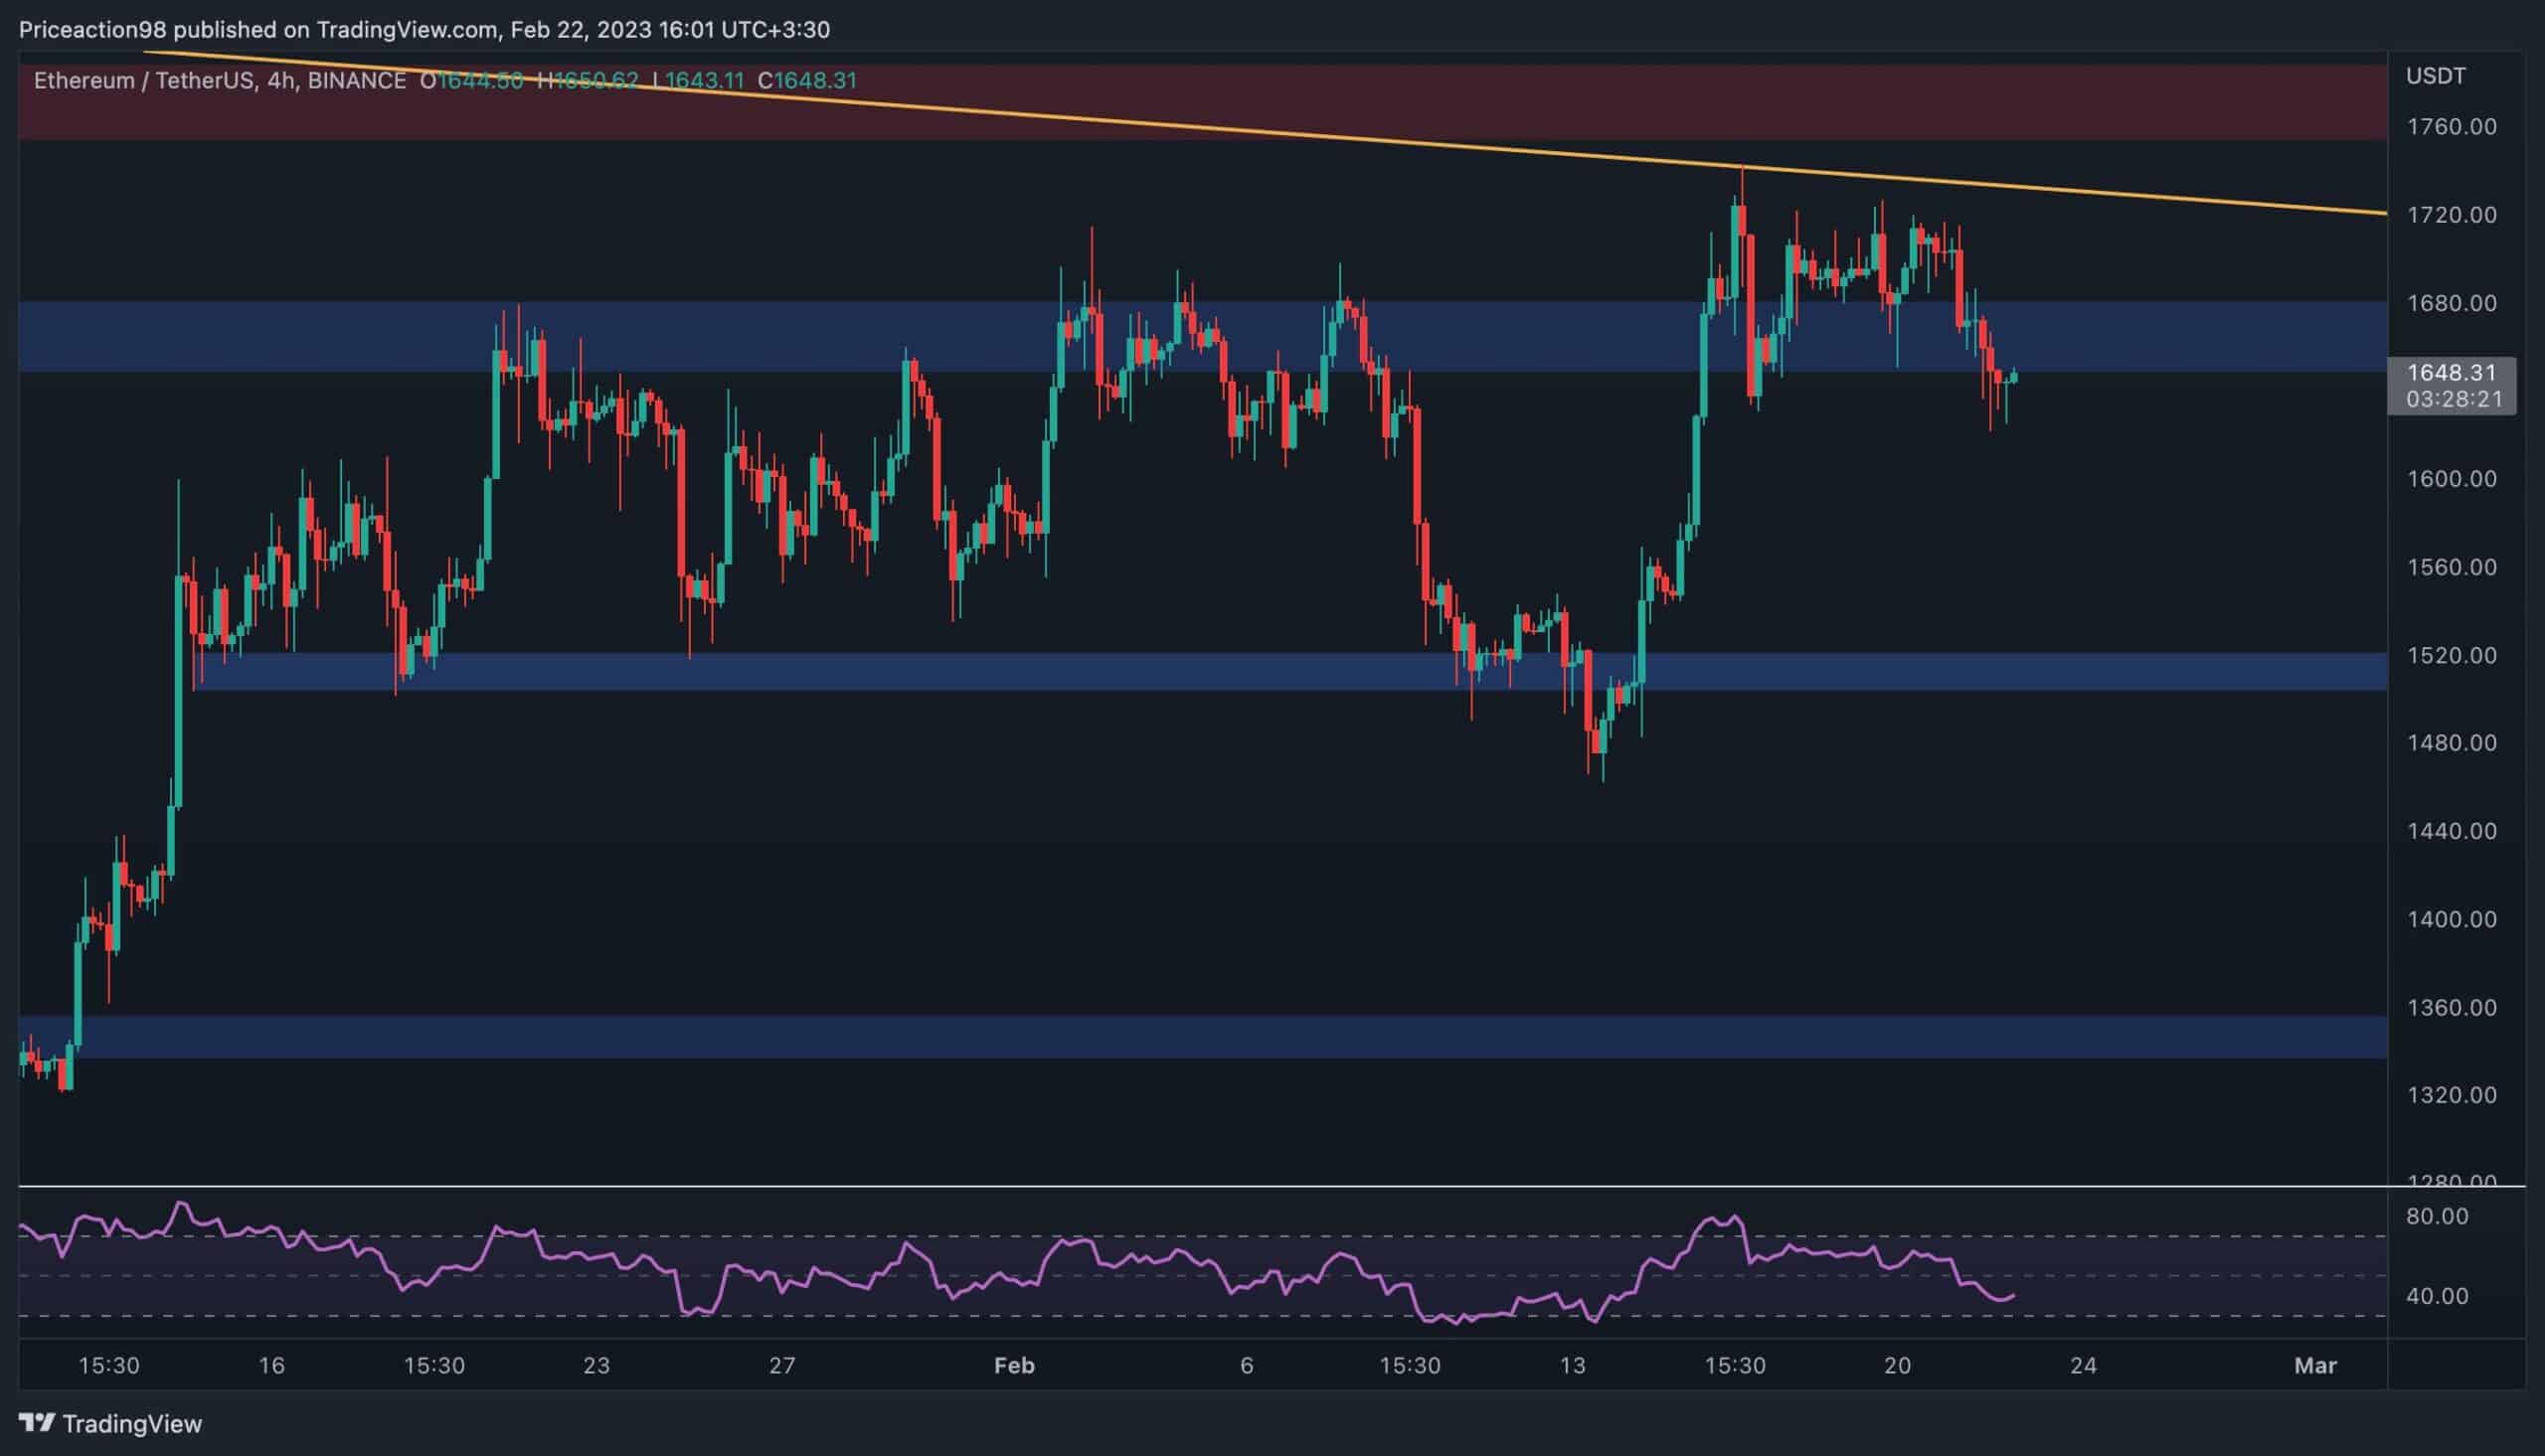
Looking at the 4-hour chart, recent price action becomes more clear. ETH is currently breaking below the $1650 support area, which could lead to a deeper decline toward the $1500 level in the short term if a valid breakout occurs.
The RSI indicator has also dropped below the 50% threshold, which points to the current seller’s domination and bearish momentum. Yet, the price could still move higher if the $1650 level holds. This could potentially lead to a break above the higher boundary of the triangle and a retest of the $1800 resistance area in the coming days.
Manatu Iloiloga
By shayan
Since 2018, the futures market has been essential in affecting Ethereum’s price. Therefore, examining its sentiment would be helpful in gaining insight into short-term price movements.
The Taker Buy Sell Ratio metric(with a 30-day SMA added) can be used to define the market’s perspective. Utilizing this feature, we can identify whether buying or selling pressure is significant, with values above one indicating bullish and below 1 showing bearish sentiment.
Simultaneously with the recent bullish trend of Ethereum, the metric was spiking, indicating a bullish sentiment in the market. However, the price entered a consolidation stage, causing a significant decline in the metric below one. As a result, it dropped to a new multi-month low, implying a dominant bearish sentiment.
The recent rally should be closely monitored in the weeks ahead to determine whether this was just another bull trap or a beginning of a new bull market, as sellers might dominate again.

Binance Free $100 (Fa'apitoa): Faaaoga lenei sootaga e resitala ma maua le $100 e leai se totogi ma le 10% fa'aitiitiga totogi ile Binance Futures ile masina muamua (tuutuuga).
PrimeXBT Faʻapitoa Faʻapitoa: Faaaoga lenei sootaga e resitala ma ulufale i le POTATO50 code e maua ai le $7,000 i au tupe teu.
Faʻasalaga: O faʻamatalaga na maua i CryptoPotato o loʻo faʻamatalaina e tusitala. E le o faʻatusalia manatu o CryptoPotato pe faʻatau, faʻatau, pe umia soʻo se tupe teufaafaigaluega. Ua fautuaina oe e taitaia lau oe suʻesuʻega aʻo leʻi faia ni filifiliga faʻavae. Faʻaaogā faʻamatalaga tuʻuina atu i ou lava tulaga lamatia. Vaʻai Faʻafitauli mo nisi faʻamatalaga.
Siata o le cryptocurrency e le TradingView.
Source: https://cryptopotato.com/eth-eyes-this-level-if-it-crashes-below-1-6k-ethereum-price-analysis/