Faʻamatalaga Vaʻaia
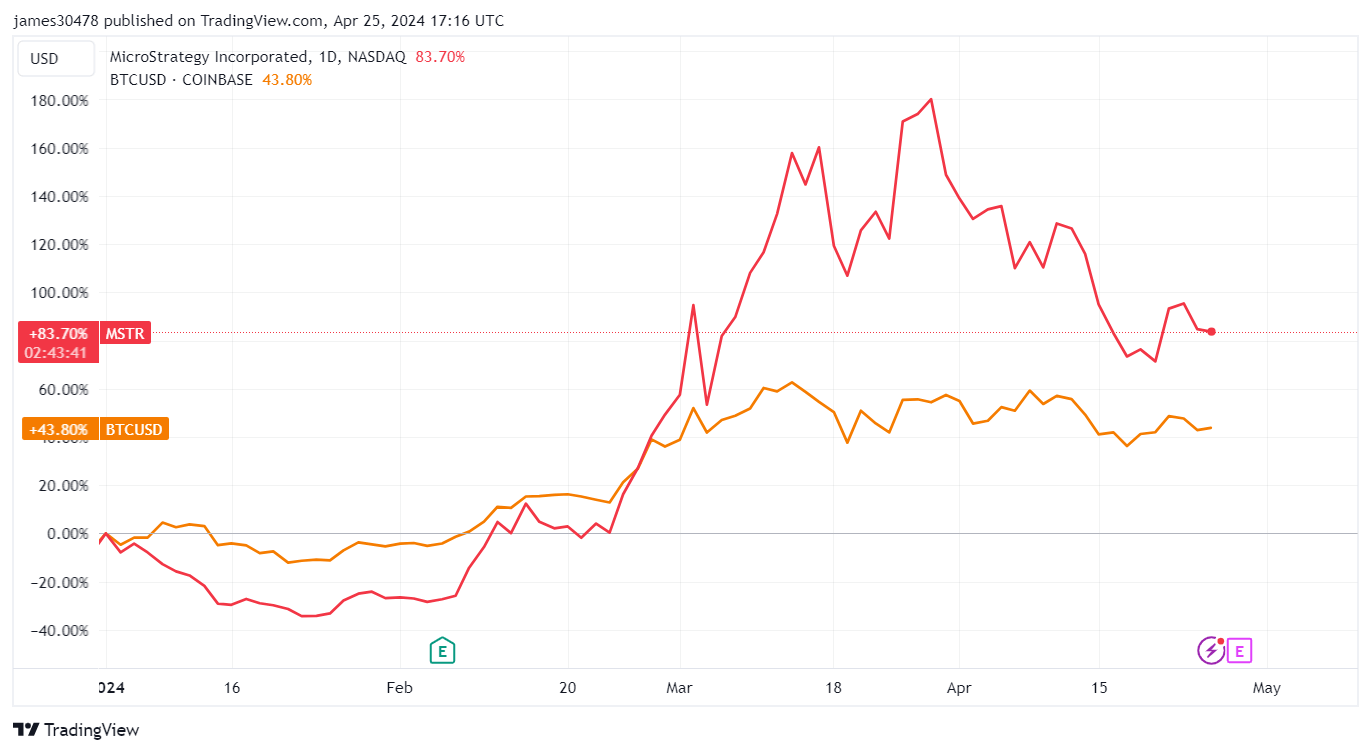
MicroStrategy (MSTR) has recently experienced a pullback in its stock price, currently trading around $1,260 per share, down 35% from its recent high of nearly $2,000. This decline is in line with Bitcoin’s (BTC) 8% pullback over the same period.
Despite the recent downturn, MicroStrategy’s stock has outperformed Bitcoin year-to-date — with MSTR up 84% compared to BTC’s 44% gain.

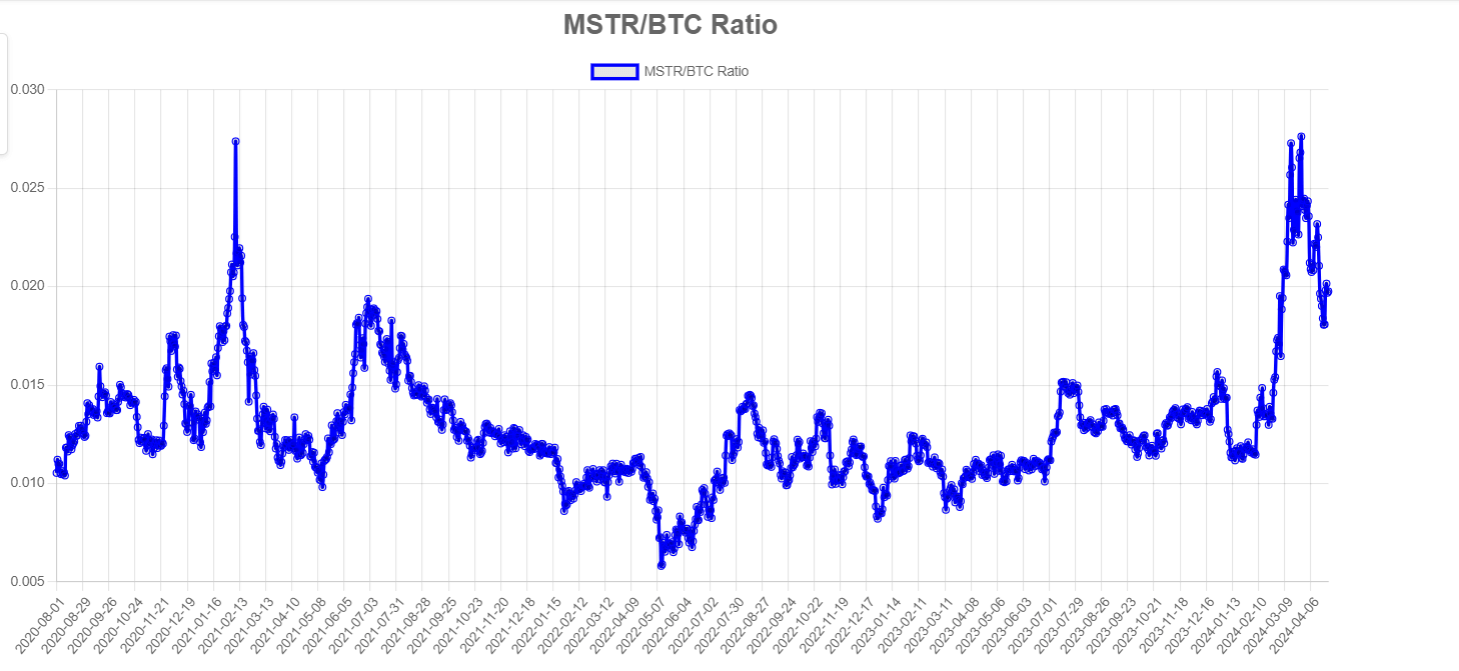
Data from the MSTR-tracker shows the “MSTR/BTC Ratio” chart, which illustrates the comparative value between MicroStrategy’s stock price and Bitcoin’s price, which peaked at around 0.028, similar to its 2021 high but has since dropped to 0.02.
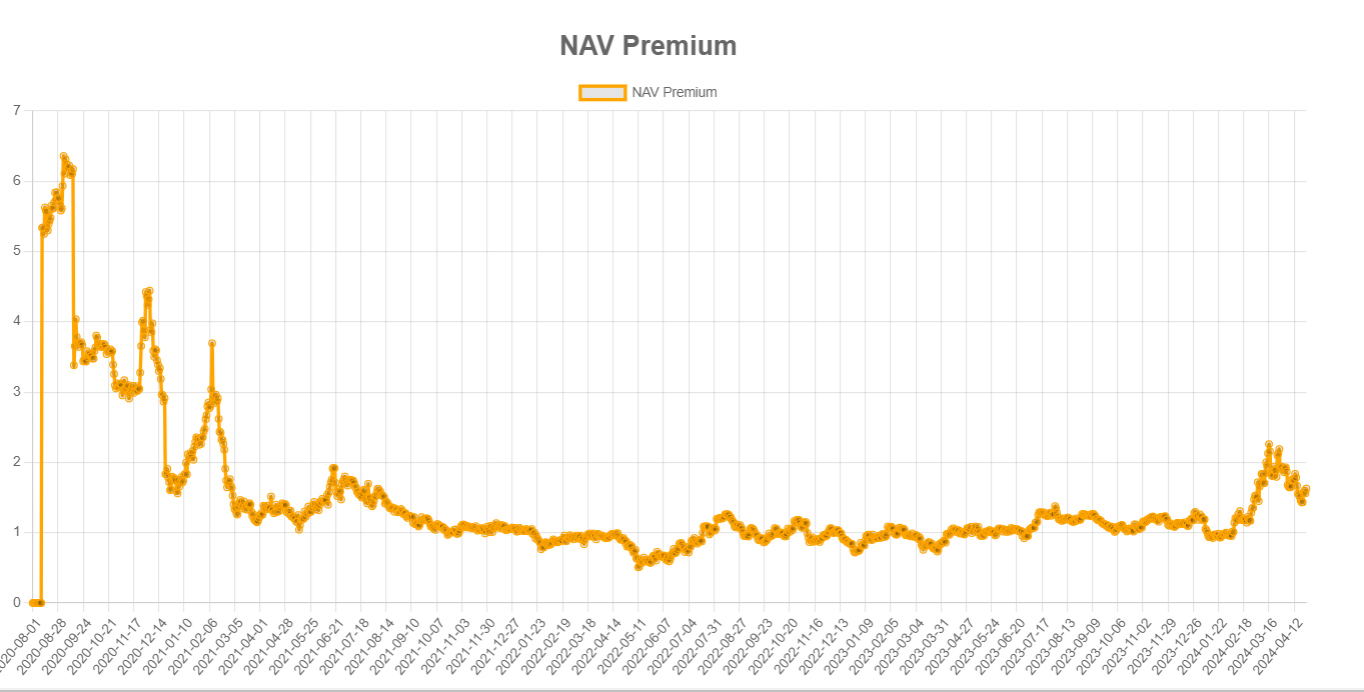
Additionally, the “NAV Premium” chart created by MSTR-tracker, which displays the premium of MicroStrategy’s stock over its Bitcoin-based Net Asset Value (NAV), has decreased from approximately 2.3 to 1.4, indicating a reduction in the market’s valuation of the company’s stock compared to its Bitcoin holdings.
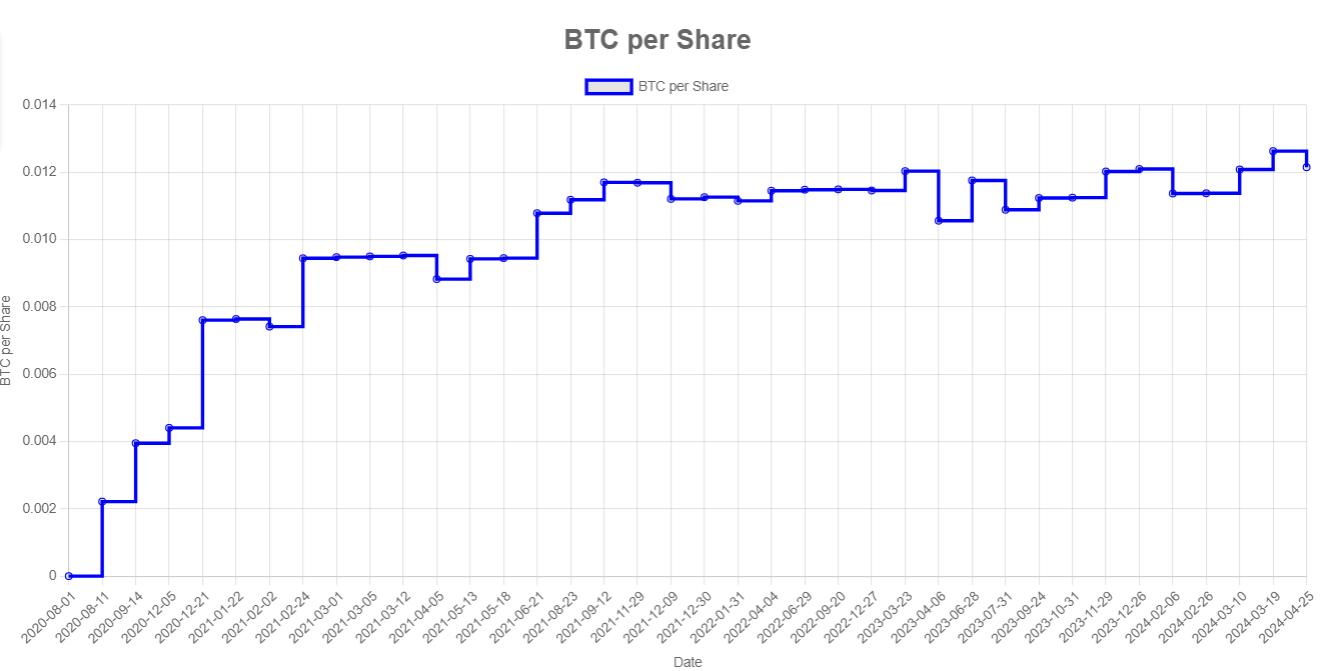
However, the most crucial metric for analyzing MSTR is “BTC per Share” — which represents the amount of Bitcoin each outstanding share of MicroStrategy equates to. This metric is currently near all-time highs at 0.012, according to MSTR-tracker, suggesting that investors are accruing more Bitcoin per share over the long-term.
Source: https://cryptoslate.com/insights/despite-market-volatility-microstrategys-btc-per-share-reaches-near-record-levels/